
The CRM, client and pipeline widgets put your sales pipeline and your best clients on the Home dashboard: deal value by stage, new and stalled opportunities, overdue follow-ups and revenue by client. They show you which deals and relationships need attention today, without opening the CRM page and filtering by hand.
In this guide you’ll learn how to:
- Read Pipeline Overview and Pipeline Growth
- Spot new deals in Recent Opportunities
- Act on Stalled Opportunities and Overdue CRM-Related Tasks
- Read Top Clients by Revenue
Before you start
- Add a widget to your dashboard from Customize, as described in How to Customize Your Dashboard.
- Each widget shows only if your profile has permission for it and the modules it reads from are switched on: CRM for the pipeline widgets, and both CRM and Invoices for Top Clients by Revenue. If you don’t see CRM in the sidebar, an admin can switch it on in Settings, Customize Navigation.
Which CRM and client widgets are there?
There are seven widgets in this group. Rows that open a record do so in a new browser tab, so your dashboard stays open.
| Widget | What it shows | Clicking a row opens |
|---|---|---|
| Pipeline Overview | Deal value in each pipeline stage | Nothing; hover a bar for detail |
| Pipeline Growth | Opportunities, companies and people over a date range | Nothing; hover a bar for detail |
| Recent Opportunities | Opportunities created in the last 14 days | The opportunity |
| Stalled Opportunities | Opportunities that have stopped moving | The opportunity |
| Overdue CRM-Related Tasks | CRM tasks past their due date | The CRM page |
| Top Clients by Revenue | Clients ranked by revenue | The client |
| Lead Source | Leads by source, as a donut chart | Nothing; hover a slice for detail |
Lead Source is covered in Monitor Documents, Contracts & Marketing Lead Sources.
Each widget has a refresh icon that appears when you hover over it, and a ⋯ menu (Widget options) to resize or remove it.
How to read Pipeline Overview
Pipeline Overview shows one bar per pipeline stage, sized by the total value of the opportunities in that stage. The total value of your pipeline sits under the title.
- Read the total under Pipeline Overview.
- Scan the bars. Stages with the most value come first, and stages with no value follow, faded.
- Hover over a bar to see the stage name, its value and how many deals it holds, or no deals.
The stages are your own pipeline stages, so the widget matches the columns on your Opportunities board. If your business has no stages yet, the widget shows Configure pipeline stages, which opens the Opportunities tab.
How to read Pipeline Growth
Pipeline Growth is a bar chart of Opportunities, Companies and People in your CRM, grouped into periods across the date range you pick.
- Choose a range in the picker at the bottom right: Last 7 days, Last 30 days, Last 90 days, Last 12 months or Custom range. The widget starts on Last 30 days.
- Read the three bars in each period. The legend underneath names each colour.
- Hover over a period to see its exact dates and counts.
When the range has no records, the widget shows a faded preview and an Open CRM button.
How to use Recent Opportunities
Recent Opportunities lists the opportunities created in the last 14 days, newest first, grouped under Today, Yesterday, Earlier this week and Earlier.
Each row shows:
- the opportunity name and its stage, as a coloured badge;
- the owner;
- the amount, or No value if no amount is set;
- the company, or the point of contact if there is no company;
- when it was created.
Click a row to open the opportunity and add the next step or the missing amount. When there are no recent opportunities, the widget offers Create an opportunity.
How to act on Stalled Opportunities
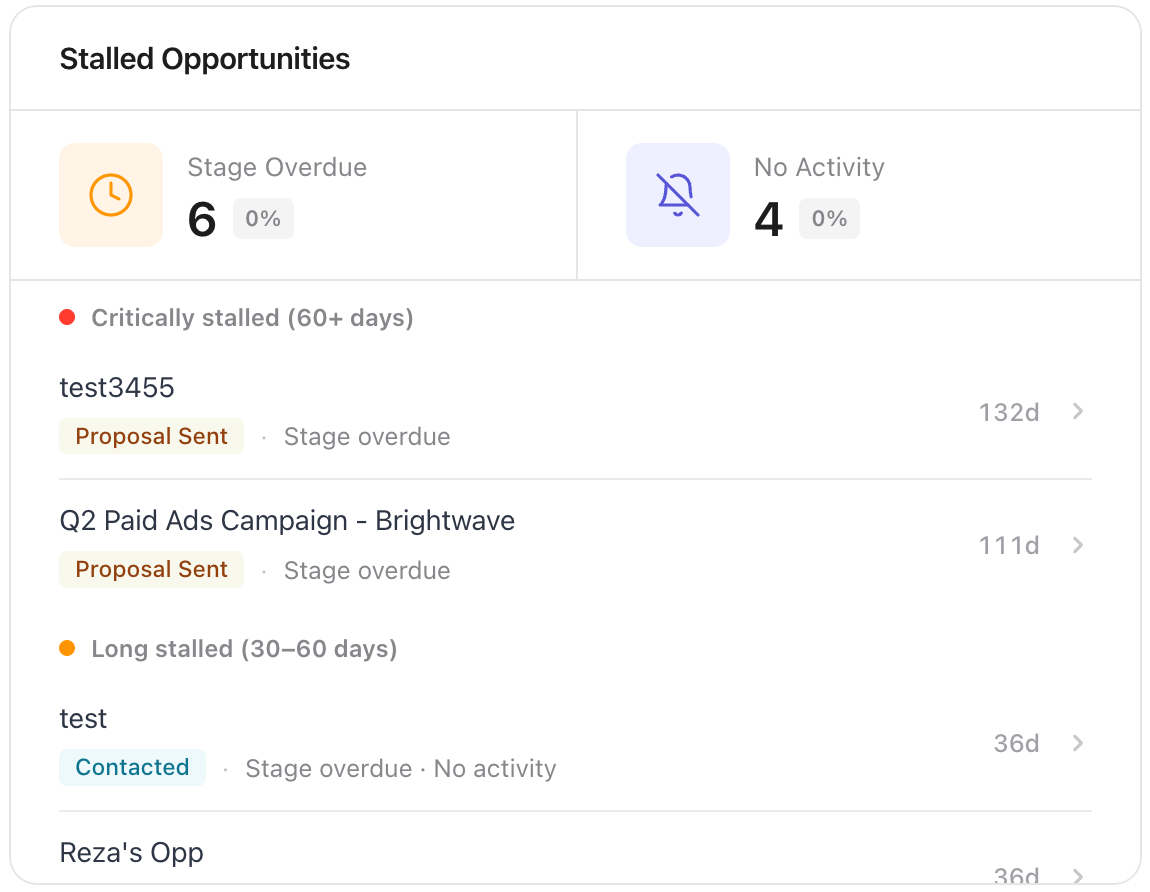
Stalled Opportunities flags deals that have stopped moving, so you can follow up before they go cold.
- Read the two counts at the top: Stage Overdue and No Activity. The small percentage beside each shows how the count has changed.
- Work down the list. Rows are grouped by how long they have stalled:
- Critically stalled (60+ days)
- Long stalled, 30 to 60 days
- Recently stalled, 14 to 30 days
- Read each row: the opportunity name, its stage badge, the flag (Stage overdue, No activity, or both) and the number of days stalled, such as 21d.
- Click a row to open the opportunity and take the next step.
OneSuite decides which opportunities count as stalled. When none qualify, the widget shows Every deal is fresh: “No opportunity has been sitting still for more than two weeks.” Click View pipeline to open your Opportunities tab.
How to act on Overdue CRM-Related Tasks
Overdue CRM-Related Tasks lists CRM tasks that have passed their due date, worst first, so no follow-up quietly slips.
- Work down the groups, in this order:
- Overdue for 2+ weeks
- Critically overdue
- Overdue for a week
- Recently overdue
- Read each row: the task title, who owns it, the person, company or opportunity it relates to, and how late it is, for example Due followed by the date and 3 days overdue.
- Check the owner. Unassigned means the task has no owner, and Created by followed by a name shows who created it.
- Click a row to open the CRM page, where you can find the task and complete or reassign it.
OneSuite decides which tasks are overdue and places them in each group. When nothing is overdue, the widget explains what it tracks and offers View all CRM tasks.
How to read Top Clients by Revenue
Top Clients by Revenue ranks your clients by the revenue from their paid invoices, biggest contributor first. Your lifetime total sits under the title, for example Lifetime followed by the amount.
Each row shows the client, their revenue, their share as a percentage of total, and how many projects they have. A bar under each row shows that share at a glance.
Paid invoices not linked to any client are grouped in one row, Other (no client). Click a client row to open that client’s profile. Before any invoice is paid, the widget shows a faded preview and a View invoices button.
Not using OneSuite yet? Start your free trial →
FAQs
What counts as a stalled opportunity in OneSuite?
A stalled opportunity is one that OneSuite flags as Stage overdue, No activity, or both. The widget groups them from Recently stalled, 14 to 30 days, up to Critically stalled (60+ days), and shows the days stalled on each row.
Why does Pipeline Overview show stages with no bar?
Those stages hold no opportunity value. They stay in the list, faded and placed after the stages with value, so you can see every stage in your pipeline.
Why does clicking an overdue CRM task open the CRM page instead of the task?
Every row in Overdue CRM-Related Tasks opens the CRM page in a new tab. Open the Tasks tab there to find the task, then complete or reassign it.
What is “Other (no client)” in Top Clients by Revenue?
Other (no client) is revenue from paid invoices that are not linked to a client. Link those invoices to a client if you want the revenue to count towards that client.
Why is a CRM widget empty on my dashboard?
The widget has no data to show yet. For example, Recent Opportunities is empty when nothing was created in the last 14 days, and Pipeline Overview is empty until you create pipeline stages.
Can I just check the CRM page instead of using these widgets?
You can, but the widgets save you the filtering. They pull stalled deals, overdue follow-ups and new opportunities onto one screen, and each row opens the record you need in a new tab.
What to do next
Shape your pipeline: Add, rename and reorder the stages these widgets report on with Understanding Pipeline Stages.
Arrange your widgets: Add, move and resize these cards with How to Customize Your Dashboard.
Learn the CRM: Get to know opportunities, companies and people with CRM Overview.