
The revenue widgets on your dashboard chart your revenue over time, project it forward, and rank the projects and clients that bring it in. They show whether your invoicing and collections are working and help you plan hiring, investment and capacity ahead of time.
In this guide you’ll learn how to:
- Read the Revenue Overview chart and change its time range
- Switch between the Trend and Forecast tabs in Revenue Forecast
- Find your highest-earning projects in Top Projects by Revenue
- Spot client concentration in Top Clients by Revenue
How to read Revenue Overview
Revenue Overview shows your revenue week by week as a line chart, compared against the same period in the prior cycle. The solid line is the current period and the dashed line is the comparison.
A rising line means your invoicing and collections are working. A plateau or dip is an early signal to review your pipeline or chase outstanding invoices.
Revenue fills in automatically once you have paid invoices. No setup is needed.
- Use the Last 30 days dropdown at the bottom right to change the time range.
- Switch between Revenue, Clients, Projects and Conversions for different breakdowns of the same period.
- Click Send an invoice → to go straight to invoice creation.
Note: the chart only reflects paid invoices, not sent or pending ones. If your chart looks empty, check that your invoices have been marked as paid.
How to use Revenue Forecast
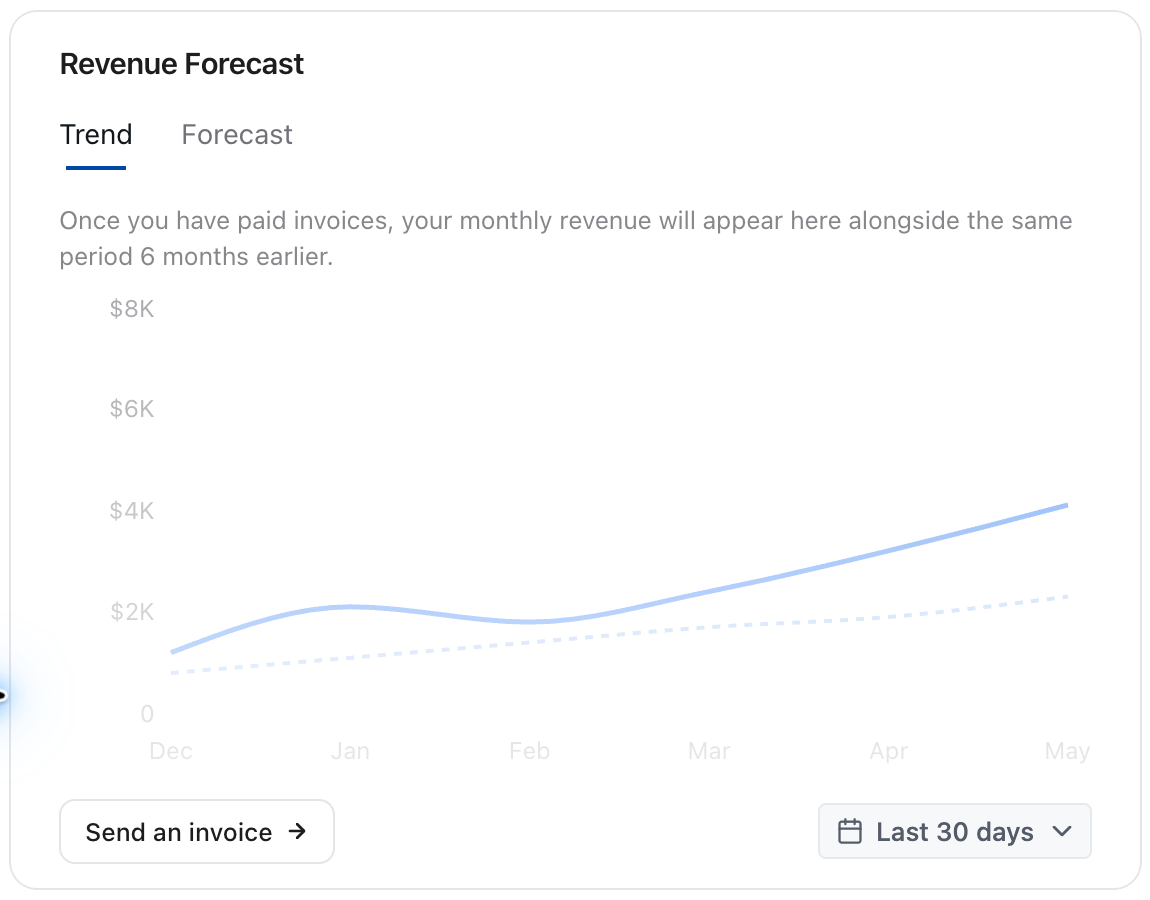
Revenue Forecast has two tabs: Trend shows monthly revenue against the same period six months ago, and Forecast shows projected future revenue based on your pipeline and invoice patterns.
Forecasting is one of the hardest parts of running an agency. This widget gives you a data-backed projection, so you can plan hiring, investment and capacity well ahead of time.
- Click the Forecast tab to switch from the trend view to the forward projection.
- Use the Last 30 days filter to adjust the time range for the trend view.
- Click Send an invoice → to add revenue that will appear in next month’s numbers.
How to read Top Projects by Revenue
Top Projects by Revenue ranks your projects by revenue generated, highest to lowest, and shows each project’s percentage of your total lifetime revenue.
Knowing which projects drive the most revenue helps you decide where to put your best people and which service lines to double down on.
- The list is sorted by revenue, highest first. The default timeframe is Lifetime.
- Click the › arrow next to any project to open its detail page.
- Watch the percentages. If one project accounts for a disproportionate share, that’s a concentration risk worth addressing.
How to read Top Clients by Revenue
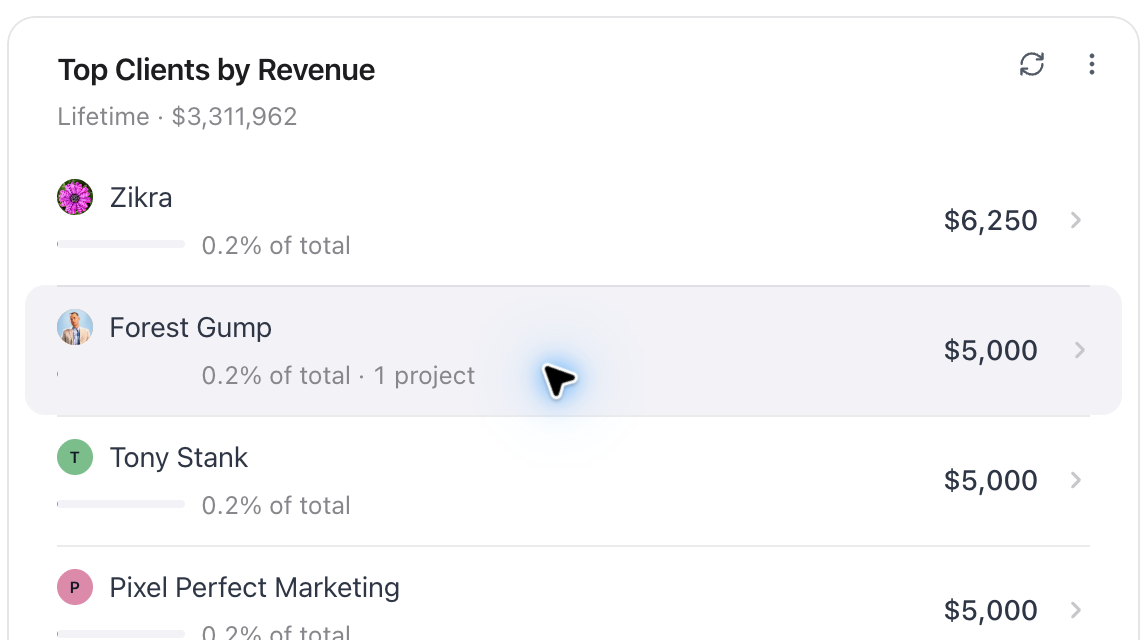
Top Clients by Revenue ranks your clients by how much revenue they’ve contributed, showing each client’s percentage of total lifetime revenue and their number of associated projects.
Your highest-revenue clients deserve your best attention. This widget also helps you spot over-reliance on one client, a common risk for growing agencies.
- Review the list regularly to make sure top clients get the attention they need.
- If any single client represents more than 30 to 40% of your revenue, consider diversifying your client base.
- Click the › arrow to open that client’s profile and review all their projects and invoices.
Not using OneSuite yet? Start your free trial →
FAQs
Why is my OneSuite revenue chart empty?
The chart only counts paid invoices, not sent or pending ones. Check that your invoices have been marked as paid, and revenue fills in automatically.
What is the difference between the Trend and Forecast tabs?
Trend compares monthly revenue with the same period six months ago. Forecast projects future revenue based on your pipeline and invoice patterns.
How do I change the time range on the revenue widgets?
Use the Last 30 days dropdown at the bottom right of Revenue Overview, or the Last 30 days filter on Revenue Forecast for the trend view.
What timeframe does Top Projects by Revenue use?
It uses Lifetime by default. Each project’s percentage is its share of your total lifetime revenue.
How much revenue from one client is too much?
If any single client represents more than 30 to 40% of your revenue, consider diversifying your client base. Top Clients by Revenue shows each client’s share.
Can I just use a spreadsheet instead to forecast revenue?
You can, but you’d have to keep it up to date by hand. These widgets fill in automatically from your paid invoices, and Forecast projects ahead from your pipeline and invoice patterns.
What to do next
Get paid faster: Mark invoices as paid so they count in these charts with How to Record Invoice Payments.
Build steady revenue: Set up invoices that repeat on a schedule with Creating Recurring Invoices.
Dig into the numbers: Go beyond the dashboard with Reports Overview.